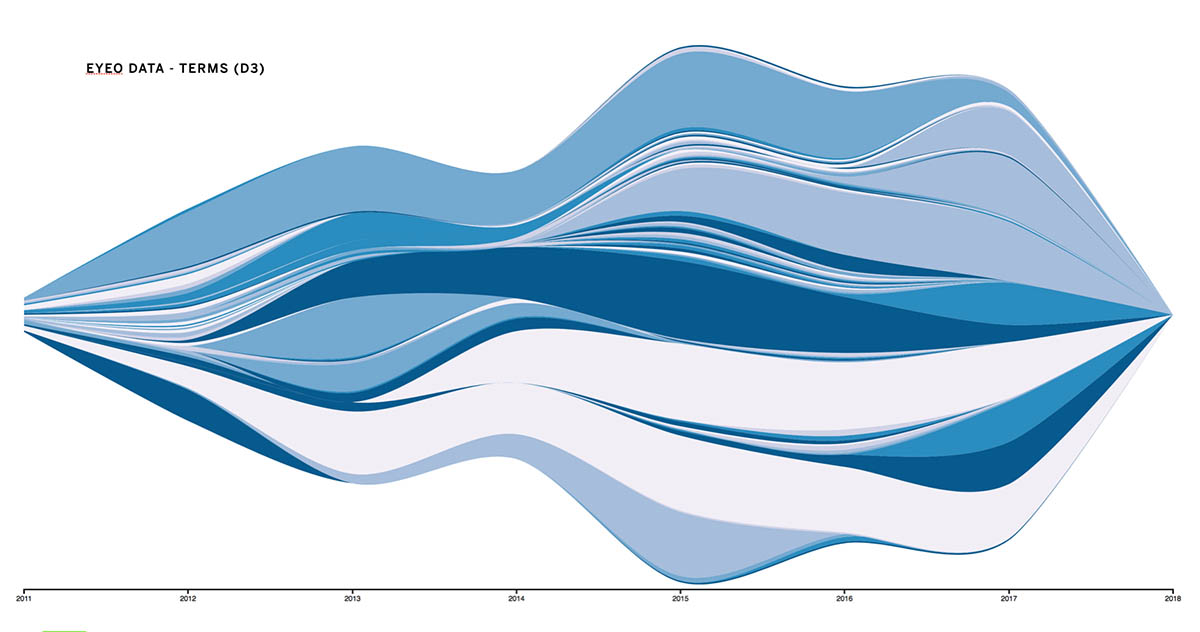
The Eyeo Festival was a design, technology, data visualization, activist, interactive and creative code conference hosted in Minneapolis every year and brought some of the most talented artists, creators and technologists to the Twin Cities each summer. I have been in 2012, 2017 and 2018 and went to the previous incarnation called flashbelt in the mid-2000s as well. After the 2017 conference I presented about what Eyeo and creative technology was all about internally at frog and made a small data exploration into the topics and speakers from previous years to understand how the topic areas may have changed over time. The resulting data visualization is visible here. The meta data and tagging of the presentations in vimeo was somewhat inconsistent, so a future version could do keyword analysis on the presentation descriptions or the transcripts of the talks themselves to paint a more accurate picture.
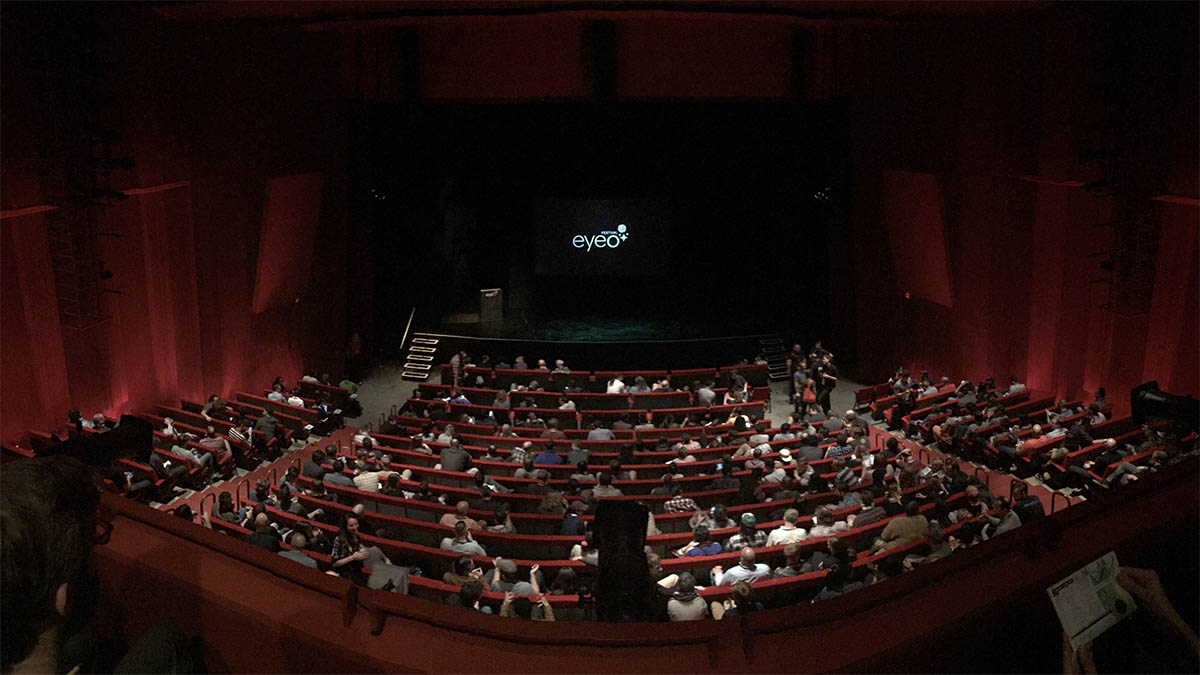
Crowd in a theater at the Eyeo festival
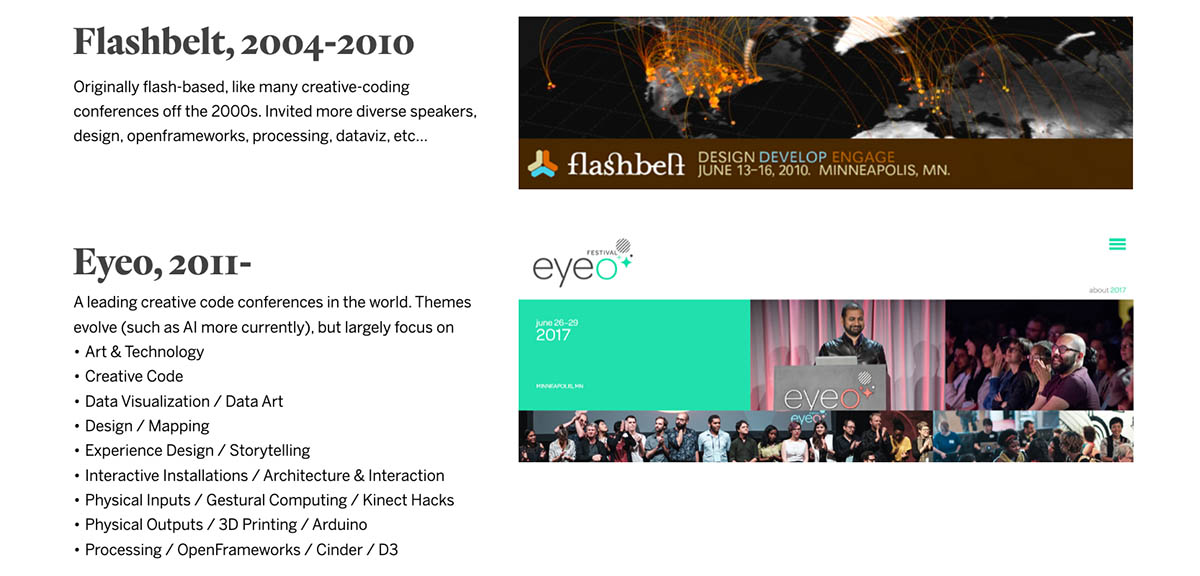
Screenshot on the history and subject matter of the Eyeo Conference
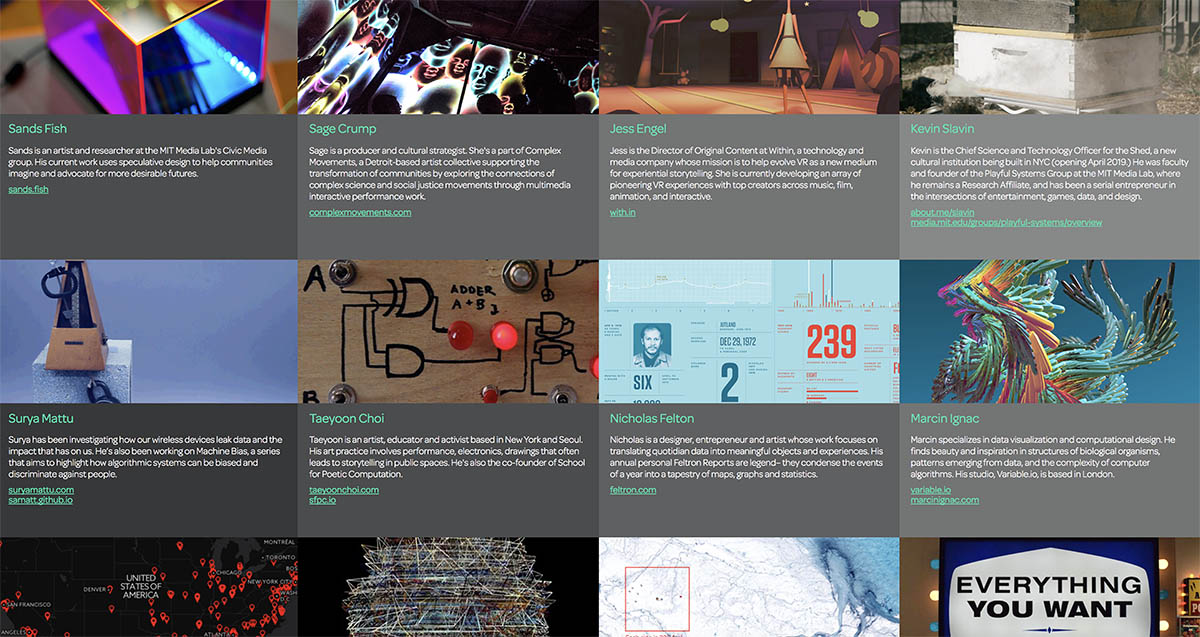
A sample of speaker intros and subject matter.
Images of the four founders of the Eyeo Festival
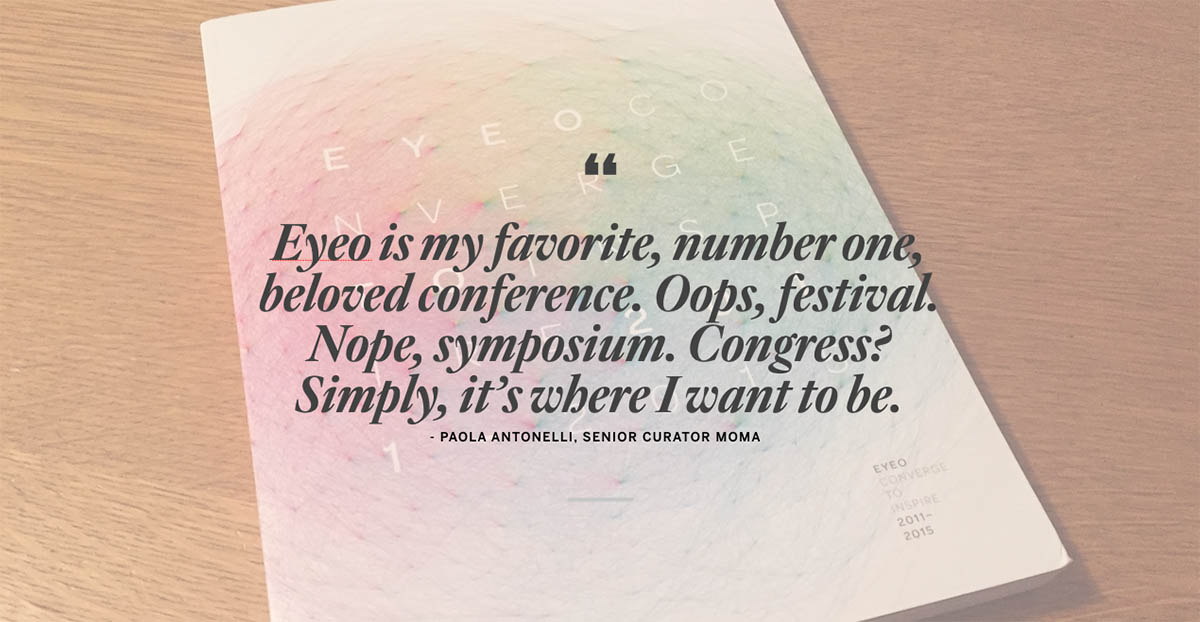
Quote about Eyeo from Paola Antonelli - Eyeo is my favorite, number one, beloved conference. Oops, festival. Nope, symposium. Congress? Simply, it’s where I want to be.
Quote about Eyeo from Paola Antonelli, "Eyeo is my favorite, number one, beloved conference. Oops, festival. Nope, symposium. Congress? Simply, it’s where I want to be."
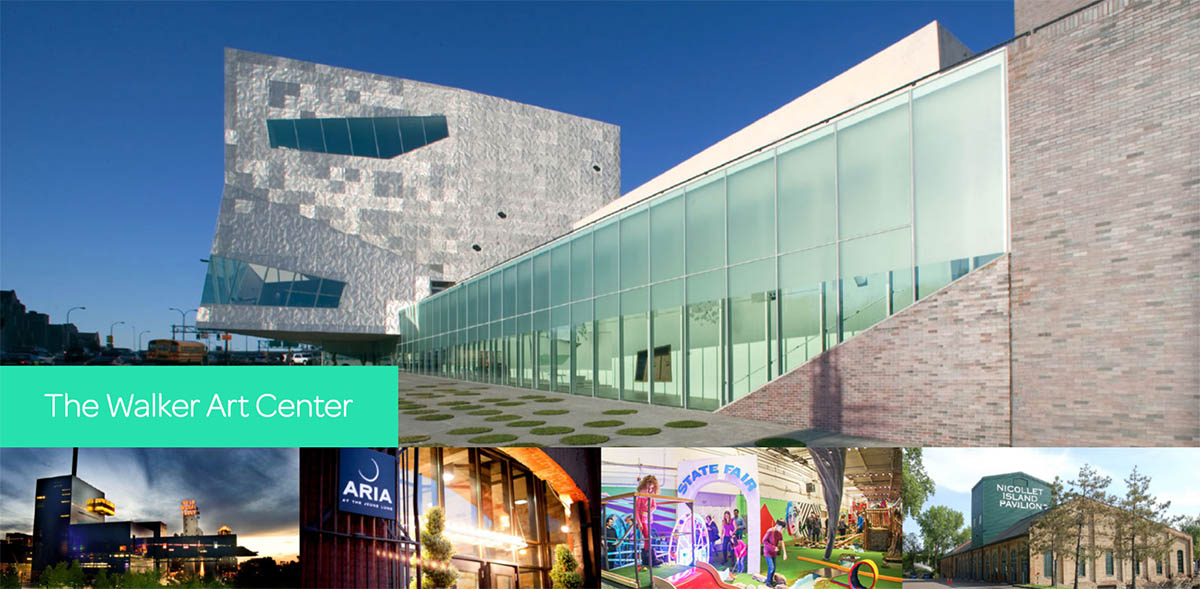
Images of the Walker Art Center and other Eyeo venues.
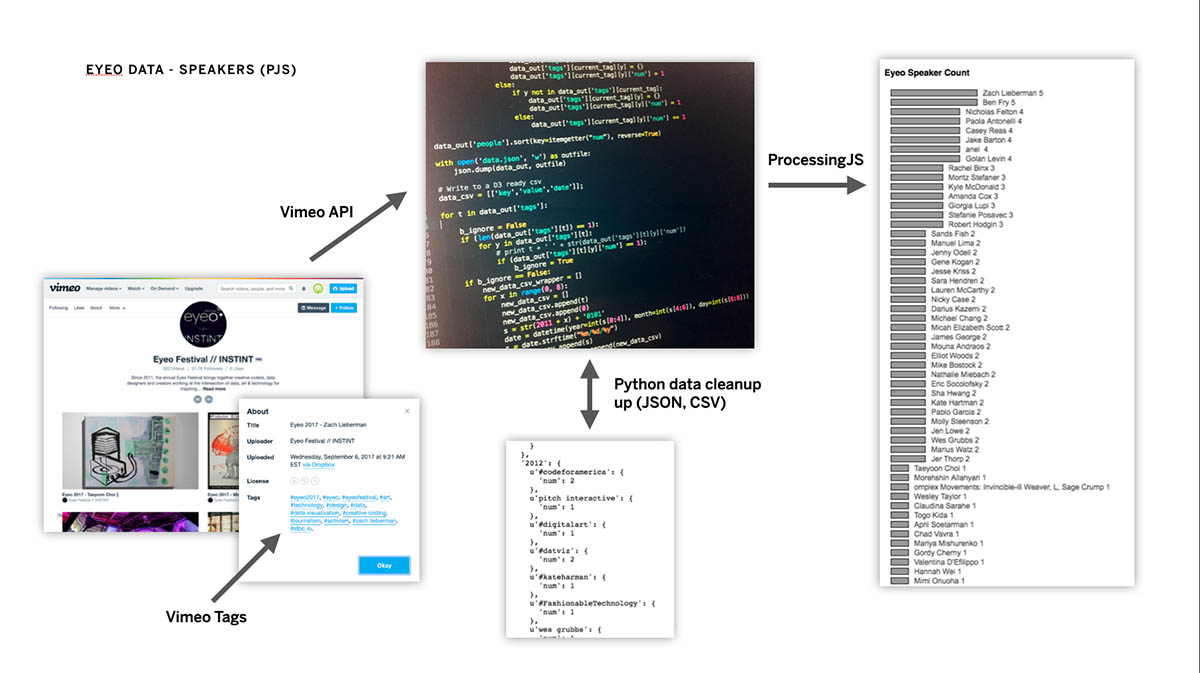
Data exploration leveraging Python to clean up and consolidate metadata from vimeo, then importing into Processing to visualize the number of times speakers have presented.
Interactive d3 flow digram of the way topics have changed over the years.